Biden announces new tariffs on imports of Chinese goods, including electric vehicles
May 14, 2024
Target scales back on its LGBTQ+ merchandise ahead of Pride Month 2024
May 15, 2024By the end of the century, residents of Faribault County in southern Minnesota can expect to endure 30 days of 100 degree-plus heat on average every year. Meanwhile, visitors to Itasca State Park in northern Minnesota will experience fewer than two days that drop below 20 degrees below zero.
Those are just two of the projections from a new online tool launched this week by the University of Minnesota Climate Adaptation Partnership, or MCAP, in conjunction with the state Department of Commerce.
The tool allows users to see how a future, warmed climate will look and feel in their own backyards. It provides highly localized climate projections across Minnesota of more than 30 different variables, including rainfall and temperature, soil moisture and snow cover, water temperature and ice cover.
It does this by generating data from global climate model simulations, and then “downscaling” it to a 2.5 square mile scale, visualizing how specific towns may experience the impact in the coming decades.
“The metaphor that I’ve been using lately is that would be like getting information for just the Minnesota State Fairgrounds, which is pretty specific,” said Suzi Clark, a climate resilience extension educator at the U.
Clark said the best most global climate change models can zoom in now is to about a 60-mile resolution.
“So that would be like having one estimate from Minneapolis to St. Cloud, roughly. And the effects of climate change could be pretty different across 60 miles,” Clark said.
The online mapping tool — called MN CliMAT— allows farmers to estimate future soil moisture in their fields; anglers to see what future water temperature and ice cover will be on their fishing lakes; and urban planners to see where extreme heat will hit hardest.
“We’re hearing from engineers, planners, foresters, farmers, homeowners — folks across the board — that they want future climate information relevant to Minnesota to inform and guide their planning and decision-making,” said Heidi Roop, director of the U’s Climate Adaptation Partnership.
“Because the future of tomorrow and beyond is very different from the climate we’ve experienced in the past,” Roop added. “So we need to start thinking about how we plan and design for a future in a climate changed world.”
How it works
The climate mapping tool allows users to search by county, tribal jurisdiction, watershed, state park or forest and several other areas of interest. People can also draw their own maps, highlighting the specific area they want to see modeled.
They then choose whether to see climate projections from mid-century (2040-2059), late century (2060-2079) and end-of-century (2080-2099), for three different emissions scenarios — intermediate, high, and very high.
Those are essentially different estimates of how much society will reduce greenhouse gas emissions in the coming years. The tool does not give a low emissions scenario option because recent reports from the Intergovernmental Panel on Climate Change suggest that scenario is increasingly unlikely.
Users can also search for climate projections by month, in a particular season, or for the length of Minnesota’s growing season.
Clark gives an example. “Let’s say you’re a farmer, who is concerned that you might deal with longer days without any rain.” They could search, say, in Stearns County, for the longest dry spell.
After selecting the criteria, the tool indicates that “at the end of the century, under very high emissions within the growing season, there could be up to 19 consecutive days without any measurable rainfall,” Clark said.
That’s just one of a huge range of scenarios the tool can model. Roop said there’s one example in particular that gives her pause.
“At the end of the century, the new data show that there will be up to 40 days per summer that exceed 100 degrees Fahrenheit,” she said. “So, I live in Minnesota, I think most of us are cold weather loving people. That is shocking. It tends to take the air out of the room.”
Roop hopes that type of information is a catalyst for how we do things including design communities, build buildings, and provide shade.
Some local governments and state agencies are already taking climate change into account when planning for the future. The Minnesota Department of Transportation has used climate projections to rank the climate vulnerability of roads and bridges around the state.
“Historic weather data is not a good predictor for what future weather looks like,” explained Brian Shekleton, principal climate and resilience planner for MnDOT.
For example, the heaviest storm in Minnesota now dumps 13 percent more rain than the heaviest storms of years past. Engineers design infrastructure to last decades, so they need to know what to plan for decades in the future.
“And so by making sure that our roadways can withstand these kinds of precipitation events and extreme weather, that's just better for residents, and it makes sense fiscally for our agencies,” said Shekleton.
The federal government plans to release updated weather guidance for transportation engineers by 2026. Shekleton said MnDOT staff are working with the climate adaptation team at the U of M to come up with climate-smart guidelines to use in the interim.
Ramsey County also developed a vulnerability assessment several years ago that details which areas of the county are most susceptible to public health impacts of climate change, said the county’s climate and health program supervisor Abi Phillips.
“And MCAP’s climate projection tool will help us understand how that might look different in the future and where we might want to be building partnerships and building a better understanding of community members’ needs,” said Phillips.
Bringing climate home
One of the many challenges of climate change is that it’s a global phenomenon, where local or regional impacts can be hard to visualize.
“This tool allows us to visualize the macro, and bring it right back down to what we think is going to happen in my backyard,” said Troy Goodnough, sustainability director at the University of Minnesota Morris, who said he’s so excited about the new website that he’s been telling “pretty much every audience I connect with” about it.
Goodnough said he anticipates using the data to help the Morris community improve upon the community resilience planning it’s already begun.
“I’m really proud of Minnesota for being in the lead to try to produce this data to help improve community decision making,” he added.
But assembling the data is only the first step. The U’s Climate Adaptation Partnership is also rolling out a series of workshops to help decision makers use that data to help make decisions about a future that still holds a lot of uncertainty.
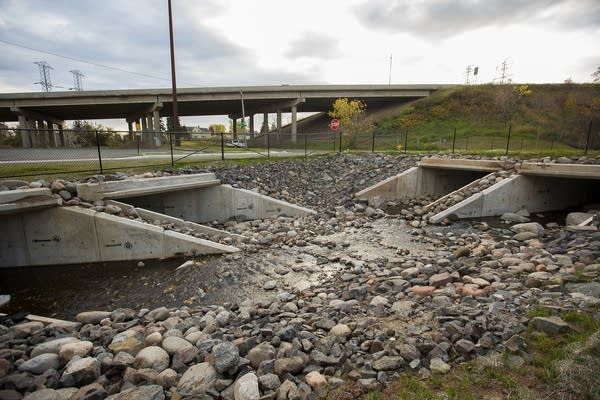
Say, for example, a county needs to install a new culvert. They know the climate is warming, and that rain storms are more extreme. They can crunch the data. But then the question becomes, how big do they build the culvert?
“Because that’s more than just climate science,” explained Roop. “There are environmental considerations, financial considerations, regulatory considerations.” Roop calls it “decision making under deep uncertainty.”

In addition to their work with MnDOT, U researchers are also collaborating with engineers and architects to make the data more usable, with farmers to develop climate-smart agriculture techniques, and also with scientists to use lake temperature data to analyze the future risk of harmful algal blooms in Minnesota lakes.
For everyday Minnesotans, university officials believe the new tool “will really bring climate change home,” said the U’s Suzi Clark,
“So people realize it’s not something that’s happening only in Fiji or in Florida. It’s happening here too. It’s already happening. And here’s what I can expect my town to look like when my grandchildren live here.”


